728x90

Troubleshooting


Problem

A problem with DNS lookup can cause slow connection to database server. This article explains one scenario and a possible solution for that problem.

Symptom

Connection request to database server from dbaccess is trying to access DNS server for hostname resolution, after it found the same in the local host file.

On certain Operating System (for example: Linux) you may noticed dbaccess (and other client applications) always doing DNS lookup while connecting to a database, even after found out the hostname or IP address in the local host file. This behavior sometimes caused slow connection, if you have problem related to DNS. Following is an excerpt of strace output shows the sequence of file accessed by a dbaccess request:

Cause

Traditionally, hostname and service name resolution were performed by functions such as gethostbyname(), getservbyname() etc. These traditional lookup functions are still available, however those are not forward compatible to IPv6. Instead, the IPv6 socket API provides new lookup functions that consolidate the functionality of several traditional functions. These new lookup functions are also backward compatible with IPv4, so a programmer can use the same translation algorithm in an application for both the IPv4 and Ipv6. The getaddrinfo() is the new primary lookup function and a connection request from the dbaccess ultimately calls this socket API. You can pass several parameters to the getaddrinfo(), one of those parameter is addrinfo structure. By default, dbaccess passes value “AF_INET6” for addrinfo.ai_family. The ai_family field indicates the protocol family associated with the request, and will be PF_INET6 for IPv6 or PF_INET for IPv4.

If the ai_family set to AF_INET6 (IPv6) the getaddrinfo() will search the DNS every time. If the ai_family set to AF_INET, then it don't query the DNS server. You can consult the 'man' page for getaddrinfo() for detailed information.

Beginning with Informix 10.00.xC4 and Client SDK 2.90.xC4, the database server checks, on startup, whether IPv6 is supported in the underlying operating system. If IPv6 is supported it is used. If the underlying operating system does not support IPv6, the IPv4 address is used.

Diagnosing The Problem

You can use the attached 'C' program to reproduce and verify the problem outside Informix.

/* 
 * gt_adr_info.c - An example of using getaddrinfo() function to validate IPV6.
 *                 compile: cc -o gt_adr_info  gt_adr_info.c 
 *                 usage: gt_adr_info <HostName>
 */

#include <stdio.h>
#include <string.h>
#include <stdlib.h>
#include <netdb.h>
#include <sys/types.h>
#include <sys/socket.h>
#include <arpa/inet.h>

int
lookup_host (const char *host)
{
  struct addrinfo hints, *res;
  int err;
  char addrstr[100];
  void *ptr;
  char *result;

  memset (&hints, 0, sizeof (hints));

  result = getenv("IFX_DISABLE_IPV6");

  if (result != NULL)
      hints.ai_family = AF_INET;
  else
      hints.ai_family = AF_INET6;

  hints.ai_flags = AI_PASSIVE;

  if ((err = getaddrinfo(host, NULL, &hints, &res)) != 0)
    {
      perror ("getaddrinfo");
      return -1;
    }

  printf ("HostName: %s\n", host);
  while (res)
    {
      inet_ntop (res->ai_family, res->ai_addr->sa_data, addrstr, 100);

      switch (res->ai_family)
        {
        case AF_INET:
          ptr = &((struct sockaddr_in *) res->ai_addr)->sin_addr;
          break;
        case AF_INET6:
          ptr = &((struct sockaddr_in6 *) res->ai_addr)->sin6_addr;
          break;
        }
      inet_ntop (res->ai_family, ptr, addrstr, 100);
      printf ("IPv%d address: %s (%s)\n", res->ai_family == PF_INET6 ? 6 : 4,
              addrstr, res->ai_canonname);
      res = res->ai_next;
    }

  return 0;
}

int
main (int argc, char *argv[])
{
  if (argc < 2)
    exit (1);
  return lookup_host (argv[1]);
}
gt_adr_info.c.txt

How to use the attached 'C' program?

1. Save the attached file as 'gt_adr_info.c'.

2, Compile the 'C' program using following command:


3. Run it as 'gt_adr_info <HostName>', where HostName is the machine name that you want to connect.

Resolving The Problem

In case of a problem with DNS lookup and encountering slow connection to database, you may use the environment variable IFX_DISABLE_IPV6 (IFX_DISABLE_IPV6=1) to disable Ipv6 and this will set the ai_family to AF_INET only and will not do subsequent query to the DNS server.


https://www.ibm.com/support/pages/possible-cause-slow-connection-database-server


A possible cause for slow connection to the database server

A possible cause for slow connection to the database server

www.ibm.com


728x90
728x90

Symptom

DML operations failing with ISAM Error -104

Cause

The 32K File Descriptors (open tables) per thread limit has been reached

Diagnosing The Problem

Use onstat -g opn and look at the ucount column

IBM Informix Dynamic Server Version 11.70.FC2 -- On-Line -- Up 14:23:05 -- 2964472 Kbytes
tid rstcb isfd op_mode op_flags partnum ucount ocount lockmode
671522 0x000000009c9e0a20 0 0x00000400 0x00000397 0x004000da 2 2 0
671522 0x000000009c9e0a20 1 0x00000002 0x00000003 0x004000da 2 2 0
671522 0x000000009c9e0a20 2 0x00000400 0x00000397 0x00100003 2 2 0
671522 0x000000009c9e0a20 3 0x00000002 0x00000003 0x00100003 2 2 0
671522 0x000000009c9e0a20 8 0x01000400 0x00000407 0x0090003c 32692 0 0
671522 0x000000009c9e0a20 9 0x01000440 0x00000797 0x0090003d 32692 0 0

(please note there are 2 partitions - 0x0090003c, 0x0090003d - each of which is opened 32692 times)

Resolving The Problem

*Check the application logic.
*Check that UDRs are not compiled with PDQ set


If you have a user defined routine (UDR) which is called as a
part of many update/delete triggers on different tables
and if the application logic in the update/delete triggers
mimics some kind of hierarchy (so a modification in one table
can cause many changes in many other tables), the UDR can get
called multiple (thousands) times in one session.

If the UDR
1) contains a query which needs to materialize some view
2) was created with PDQPRIORITY > 0 (or the last 'update
statistics low [for procedure]' command was run with PDQPRIORITY
> 0)

each of its invocations materializes the view, leaving the base
tables opened at the RSAM level.


728x90
728x90

Question

Your read cache rate (onstat -p) rises durning server use to ninety-nine percent. You suspect that you have overallocated buffers to the extent that you are wasting memory. How can you determine how much of your buffer cache memory is used?

Answer

Count the number of buffers in use at regular intervals and compare with the total allocated. You can use the following two methods to count the number of buffer pages in use at a given point in time:

  • Execute the onstat -B command. The number of data lines in the output is the number of buffers in use. The onstat -B output includes all the configured buffer pools, grouped by page size. You will have to count the lines in the individual groups if you have more than one buffer pool.


  • Open the sysmaster database and execute the following query:

    SELECT COUNT(*) AS pages_used
    FROM sysbufhdr
    WHERE bufsize = <buffer_page_size>
    AND bflags != 4;

    The buffer_page_size is the page size (in bytes) for the buffer pool you are examining. The buffer page size is listed in the onstat -b/B output. If you only have one buffer pool, you can leave out the buffer page size filter and the query becomes:

    SELECT COUNT(*) AS pages_used
    FROM sysbufhdr
    WHERE bflags != 4;


https://www.ibm.com/support/pages/how-do-i-know-if-my-buffers-are-overallocated


How do I know if my Buffers are Overallocated?

How do I know if my Buffers are Overallocated?

www.ibm.com


728x90
728x90

Question

Your IBM Informix server is processing queries more slowly than expected. You want to determine what is slowing the instance. Were do you start your analysis?

Answer

Preconditions

  • This performance problem is not limited to one query or a class of queries.
  • The database statistics (UPDATE STATISTICS) were collected with appropriate performance considerations and are current.
  • The performance is a problem for both network connections to the server and shared memory connections.

Recommended Approach

Informix servers provides a number of commands, the onstats, for reporting system status. You can generally start your analysis using seven of the commands. Examination of the data often leads to further analysis and resolution. The recommended commands are:

  • onstat -m

    Message log. The message log contains warning and error messages. The onstat -m only reports recent updates to the log file. You may want to look at earlier log entries.

  • onstat -u

    User thread status. Look for user threads waiting on a resource. You will see a wait indicator in the first position of the flags field. The address of the resource is in the wait field. The specific wait flag, the type of resource, and cross references follow:

    B - wait on buffer - match the wait address to a buffer in onstat -b

    C - wait on checkpoint - examine onstat -g ckp and onstat -g con

    G - wait on write to log buffer - match the wait address to a log buffer in onstat -l

    L - wait on lock - match the wait address to the address of a lock in onstat -k

    S - wait on latch - match the wait address to a latch (mutex) in onstat -lmx and onstat -wmx

    Y - wait on condition - listed in onstat -g con and do not typically reflect performance problems to the extent that they help with diagnosis

    There are several other flags but they are rarely observed.

    The first field of the onstat -u output, address, maps to the rstcb field of the onstat -g ath output for thread identification. The sessid field is the session id (SID). You can learn more about resources allocated to a session and its activity with onstat -g ses <SID>.

    Collect onstat -u several times in rapid succession. If the waiters persist over a measurable clock time, then the chances are very good that the waits reflect a processing problem that affects performance. Some waiters are normal but they should disappear quickly. Keep in mind that lock waits are programmed.

    The last two fields of onstat -u, nreads and nwrites, can be useful indicators of thread activity.

  • onstat -p

    Server statistics. The single most important performance statistic in this output is the read cache rate (the first %cached field). Your goal for an OLTP system is to have a read cache rate above 95 percent during normal processing. Try for a rate above 99 percent. Increase the cache rate by adding buffers, which are configured using the BUFFERPOOL configuration parameter. Make sure that you have plenty of system memory (onstat -g osi) when increasing the Informix server memory allocation. Increasing the server memory footprint can indirectly slow the instance by increasing paging/swapping at the OS side. You can use a sysmaster query (see Related Information below) to help determine if you have configured too many buffers.

    Other statistics, like bufwaits (waiting for buffer), seqscans (sequential scans), and the read aheads should be considered. In the case of read aheads, the sum of ixda-RA, idx-RA, and da-RA should be close to the value of RA-pgsused as an indicator of effective read-ahead configuration.

    Many of the same statistics are viewed on a partnum level with onstat -g ppf.

    Consider collecting and retaining onstat -p outputs at regular intervals for comparison. Note that cumulative statistics are zeroed with onstat -z if you want to observe statistics over a limited time interval.

  • onstat -g rea

    Ready queue. Reports threads ready to execute at one moment in time. These threads are prepared for execution but lack cpu resource. If the number remains above the number of cpu virtual processors (onstat -g glo) through repetitions of onstat -g rea, then your system is likely limited by processing power. Look for inefficient queries and non-server processing on the machine. See onstat -g glo output for cpu use integrated over time and onstat -g osi for system resources.

  • onstat -g act

    Active threads. You will usually see poll threads and listen threads in this queue. Look for threads doing query-related work, like sqlexec and I/O threads. If none show up or they are rare, then work is not getting to the processors.

  • onstat -g ioq

    I/O request queues. The statistic to monitor is the maxlen column. This is the maximum length of a queue after the engine was brought online or onstat -z was executed. If the number is too large, then at some point the I/O requests were not serviced fast enough. Try executing onstat -z and checking to see how long it takes for large maxlen values to return.

    For informix aio monitor the gfd (global file descriptor) queues. The maxlen should not be greater than 25. The system uses gfd 0, 1, and 2 (stdin, stdout, stderr), so the informix chunks start with gfd 3 (chunk 1).

    If you are using kaio monitor the kio queues. The maxlen values should not exceed 32. There will be one kio queue for each cpu virtual processor.

    Recommendations for maxlen with DIRECT_IO enabled have not been determined, but are not expected to be larger than 32.

  • onstat -g seg

    Shared memory allocations. The shared memory configuration parameters should be tuned so that the server dynamically allocates at most two virtual segments during normal processing.


https://www.ibm.com/support/pages/where-do-i-start-diagnosis-generally-slow-performance-informix-servers


Where do I start with Diagnosis of Generally Slow Performance on Informix Servers?

Where do I start with Diagnosis of Generally Slow Performance on Informix Servers?

www.ibm.com


728x90
728x90

Question

This document describes a few methods that can be used to find files opened by a process. This information can be useful when debugging processes that open too many files, or have a file leak.

Answer


Introduction

A system administrator might find it necessary to obtain information about all files that are currently opened by a process. A process might have a defect that causes it to continuously create files without closing them, or it might open files, read and write to those files, but fail to close the files afterwards. In such cases it is useful to obtain as much information as possible about the files that have been opened by a process to help pinpoint the cause of the problem. AIX has a virtual file system mounted at /proc that provides information about running processes, including the files opened by those processes. AIX also includes a number of commands that can be used to obtain information about files opened by processes. Open Source commands such as lsof can also be used.

/proc File System

The /proc file system is a virtual file system, meaning it does not contain actual files residing on a disk or in RAM. But the /proc file system contains virtual files that can be manipulated just like real files. These virtual files provide information about processes currently running on a system, using standard UNIX commands and methods for accessing files. Under /proc there are virtual directories named with the process IDs (PIDs) of all processes currently running on the system. Inside of each of these directories are more subdirectories. These subdirectories organize all of the available information about running processes. One of the subdirectories is named fd, an abbreviation for file descriptor. Inside fd is a list of virtual files with numbers for file names. These numbers are the file descriptor numbers assigned by the operating system to the real files that have been opened by the process. In the following example, we find that the process with PID 184422 has only one opened file with file descriptor 4.

# cd /proc/184422/fd
# ls -l total 16 -r--r--r--   1 root system   4811 Jul 12 2004  4

procfiles Command

The AIX procfiles command lists all files opened by a process. For each file the command also provides the inode number for the file, and additional information such as the file size, and uid and gid. Here is an example of procfiles output for the same process with PID 184422 that we found in the /proc file system above.

# procfiles 184422

184422 : /usr/sbin/hostmibd
  Current rlimit: 2147483647 file descriptors
   4: S_IFREG mode:0444 dev:10,5 ino:13407 uid:0 gid:0 rdev:0,0
      O_RDONLY size:4811

Again we see that process 184422 has one opened file with file descriptor 4. File descriptor 4 has major,minor numbers of 10,5 and an inode number of 13407. We can use the following procedure to find the device where the file is located.

# cd /dev
# ls -l | grep "10, *5"
brw-rw----   1 root     system       10,  5 Oct 10 2005  hd2
crw-rw----   1 root     system       10,  5 Oct 10 2005  rhd2

So the device or logical volume that contains the file system in this example is /dev/hd2.

# lsfs | grep hd2
/dev/hd2        --         /usr           jfs2 3801088 yes no

This filesystem is mounted at /usr.

We can use the following command to obtain information about the file with file descriptor 4 and inode 13407.

# istat 13407 /usr
Inode 13407 on device 10/5
File Protection: rw-r--r--
Owner: 2(bin)           Group: 2(bin)
Link count:   1         Length 4811 bytes
Last updated:   Tue Aug 24 16:14:48 CDT 2004
Last modified:  Mon Jul 12 11:33:31 CDT 2004
Last accessed:  Wed Aug  9 09:16:28 CDT 2006
Block pointers (hexadecimal): 1892c

We can use find command to find all file names in the filesystem /usr with an inode of 13407.

# cd /usr
# find . -inum 13407 -exec ls -l {} \;
-rw-r--r--   1 bin      bin            4811 Jul 12 2004
./lib/nls/msg/en_US/hostmibd.cat

Notice the 1 just before the first bin. This indicates that there is only 1 hard link, meaning the file name hostmibd.cat is the only file name associated with this inode.

pstat Command

The AIX pstat command can be used to list all files opened by a process. Here is an example that finds all files currently opened by the cron process.

# ps -ef | grep cron
    root 323762      1   0   Oct 06      -  0:07 /usr/sbin/cron

The PID for cron is 323762, which is 0x4F0B2 in hex.

# pstat -a | grep -i 4F0B2
SLT ST    PID   PPID   PGRP   UID  EUID  TCNT  NAME
 79 a   4f0b2      1  4f0b2     0     0     1  cron

We can use the slot number to display the file system state info and the file descriptor table. In this example we see that cron has 13 opened files, numbered from 0 to 12.

# pstat -u 79 | grep FILE
FILE SYSTEM STATE
FILE DESCRIPTOR TABLE

# pstat -u 79 | grep -p "FILE DESCRIPTOR TABLE"
FILE DESCRIPTOR TABLE
    *ufd: 0xf00000002ff49e20
    fd 0:  fp = 0xf1000714500080e0   flags = 0x0080  count = 0x0000
    fd 1:  fp = 0xf100071450007fa0   flags = 0x0080  count = 0x0000
    fd 2:  fp = 0xf100071450007fa0   flags = 0x0080  count = 0x0000
    fd 3:  fp = 0xf100071450007780   flags = 0x0080  count = 0x0000
    fd 4:  fp = 0xf100071450007af0   flags = 0x0080  count = 0x0000
    fd 5:  fp = 0xf1000714500079b0   flags = 0x0080  count = 0x0000
    fd 6:  fp = 0xf1000714500066a0   flags = 0x0080  count = 0x0000
    fd 7:  fp = 0xf100071450008270   flags = 0x0080  count = 0x0000
    fd 8:  fp = 0xf1000714500081d0   flags = 0x0080  count = 0x0000
    fd 9:  fp = 0xf100071450008220   flags = 0x0080  count = 0x0000
    fd 10:  fp = 0xf100071450008180   flags = 0x0080  count = 0x0000
    fd 11:  fp = 0xf1000714500082c0   flags = 0x0080  count = 0x0001
    fd 12:  fp = 0xf100071450008130   flags = 0x0081  count = 0x0000

lsof Command

The lsof command is an open source command available for free on the internet. lsof is a very powerful command with many options so we only list a few uses for lsof in this document.

# lsof -u account | wc -l
Displays the total number of open file handles in the specified account.

# lsof -u account | grep pid | wc -l
or
# lsof -p pid
Displays the total number of open files in the specified account name for the specified pid.

lsof indicates if the file descriptor is associated with an open socket or an open file.

Conclusion

The /proc virtual file system and the AIX commands procfiles and pstat can be used to list information about files that are currently opened by a process. This information can be used to investigate processes that are having certain types of problems with files. The open source lsof command is also useful for providing information about files opened by processes, and files opened under specific user accounts.


728x90
728x90

Troubleshooting


Problem

This article describes a problem which occurs when CURRENT does not recalculate the actual date and time when called more than once in a stored procedure.

Resolving The Problem


PROBLEM

Repeated calls to the CURRENT function within a stored procedure always returns the same value.

This problem is typically seen when the stored procedure uses a cursor that loops through large quantities of data, such that by the time the final row is reached, the actual time has moved on and CURRENT no longer hold the true system datetime.


CAUSE

If using CURRENT in a stored procedure, the datetime value is set to the current system datetime at the time the procedure is called. CURRENT is not updated while the stored procedure is running.


SOLUTION

The system table sysmaster:sysshmvals.sh_curtime stores the exact system datetime. Run the following query within your stored procedure to return the actual time and store it into the local variable current_time.

select DBINFO('utc_to_datetime', sh_curtime) into current_time
from sysmaster:sysshmvals;

The following example demonstrates the different results returned when comparing the use of the CURRENT function with that of the sysshmvals query shown above.


Example:

create database currdemo;

create table dates (text char(20),
                    time datetime year to second);

create procedure test()
define i int;
define current_time datetime year to second;


insert into dates values ("current 1st run", CURRENT);

select DBINFO('utc_to_datetime', sh_curtime) into current_time
from sysmaster:sysshmvals;
insert into dates values ("realtime 1st run", current_time);

system "sleep 5" ;

insert into dates values ("current 2nd run", CURRENT);

select DBINFO('utc_to_datetime', sh_curtime) into current_time
from sysmaster:sysshmvals;
insert into dates values ("realtime 2nd run", current_time);

end procedure;

execute procedure test();

select * from dates order by text;


The output looks as follows:

text                 time

current 1st run      2006-10-31 17:02:11
current 2nd run      2006-10-31 17:02:11
realtime 1st run     2006-10-31 17:02:11
realtime 2nd run     2006-10-31 17:02:16


출처 : https://www.ibm.com/support/pages/how-obtain-actual-date-and-time-stored-procedure

728x90
728x90

안녕하세요. 이번 글에서는 인포믹스 테이블 복구 기능에 대해서 소개드리고자 합니다.

데이터베이스의 물리적인 오류나 사용자의 실수로 데이터가 손실되었을 때 테이블 복구 기능을 사용합니다.


오라클의 FLASHBACK과 유사한 기능으로 볼수도 있습니다. FLASHBACK은 언두영역의 과거 데이터를 복구하는 반면, 인포믹스의 테이블 복구기능은 백업본을 스캔하여 특정 테이블의 데이터를 추출하여 복구합니다.


Informix의 테이블 복구기능의 장점은 아래와 같습니다.

1. ontape 또는 onbar로 백업받은 이미지가 존재할 경우, 백업된 시점의 데이터를 복구할 수 있다.

2. 백업 전체를 리스토어 할 필요없이 특정 테이블만 추출하여 복구가 가능하다. 따라서 복구시 테이블 크기만큼의 여유공간만 필요하므로 효율적이다.

3. 기존 테이블과 다른 이름의 테이블, 또는 CSV파일 형식으로 지정하여 복구할 수 있다.

4. onbar의 경우 log restore가 가능하다. 즉, 특정 시점을 지정하여 복구 가능하다.


인포믹스 테이블 복구에는 archecker라는 유틸리티를 사용합니다.

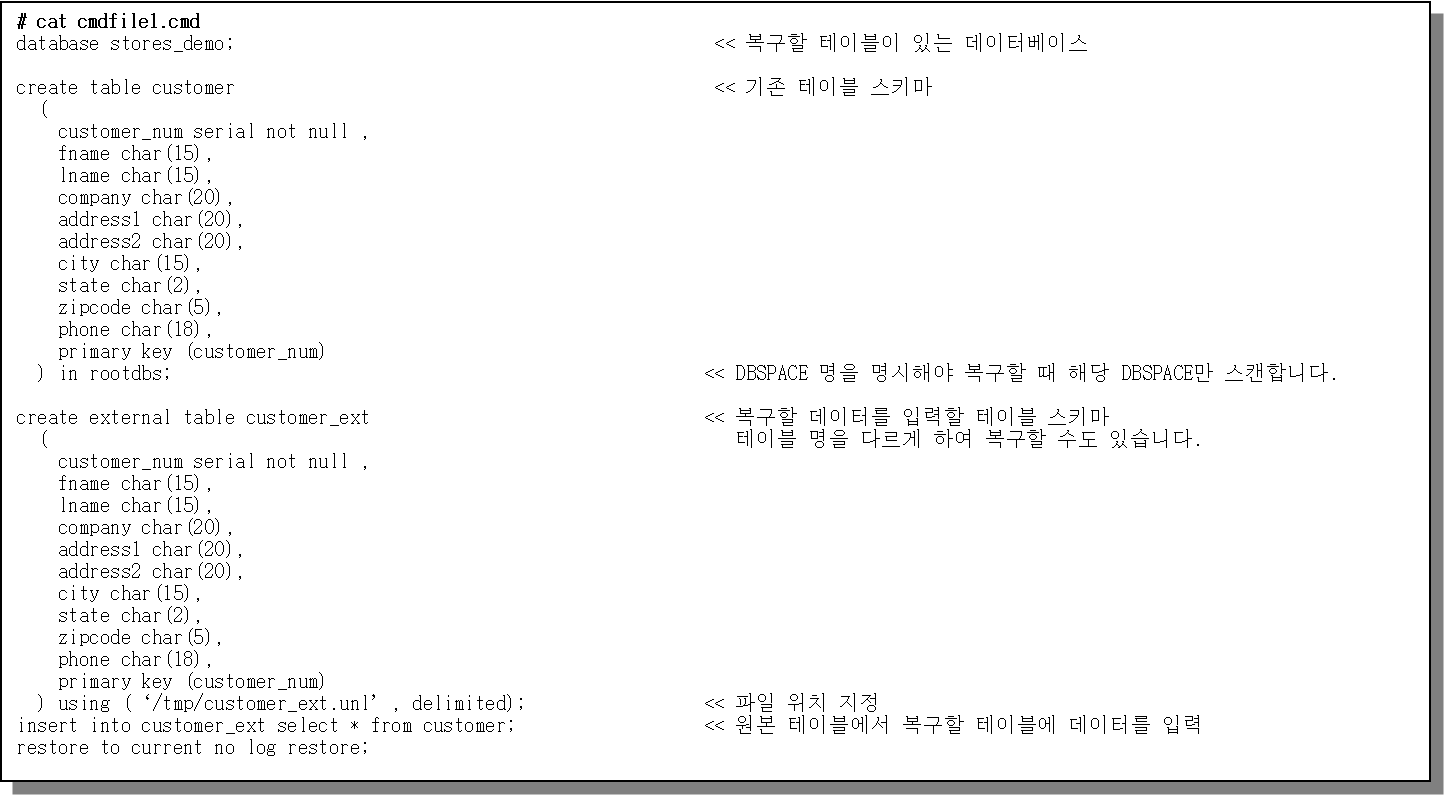
복구를 수행하려면 대상 테이블의 CREATE TABLE 문장이 포함된 스키마 커맨드 파일이 필요합니다.

테이블 복구 명령 개요


아래는 스키마 커맨드 파일의 예시입니다. 텍스트 형식의 파일입니다.

특정 테이블의 데이터를 다른 테이블 명으로 복구하는 시나리오
특정 테이블 데이터를 파일로 복구하는 시나리오

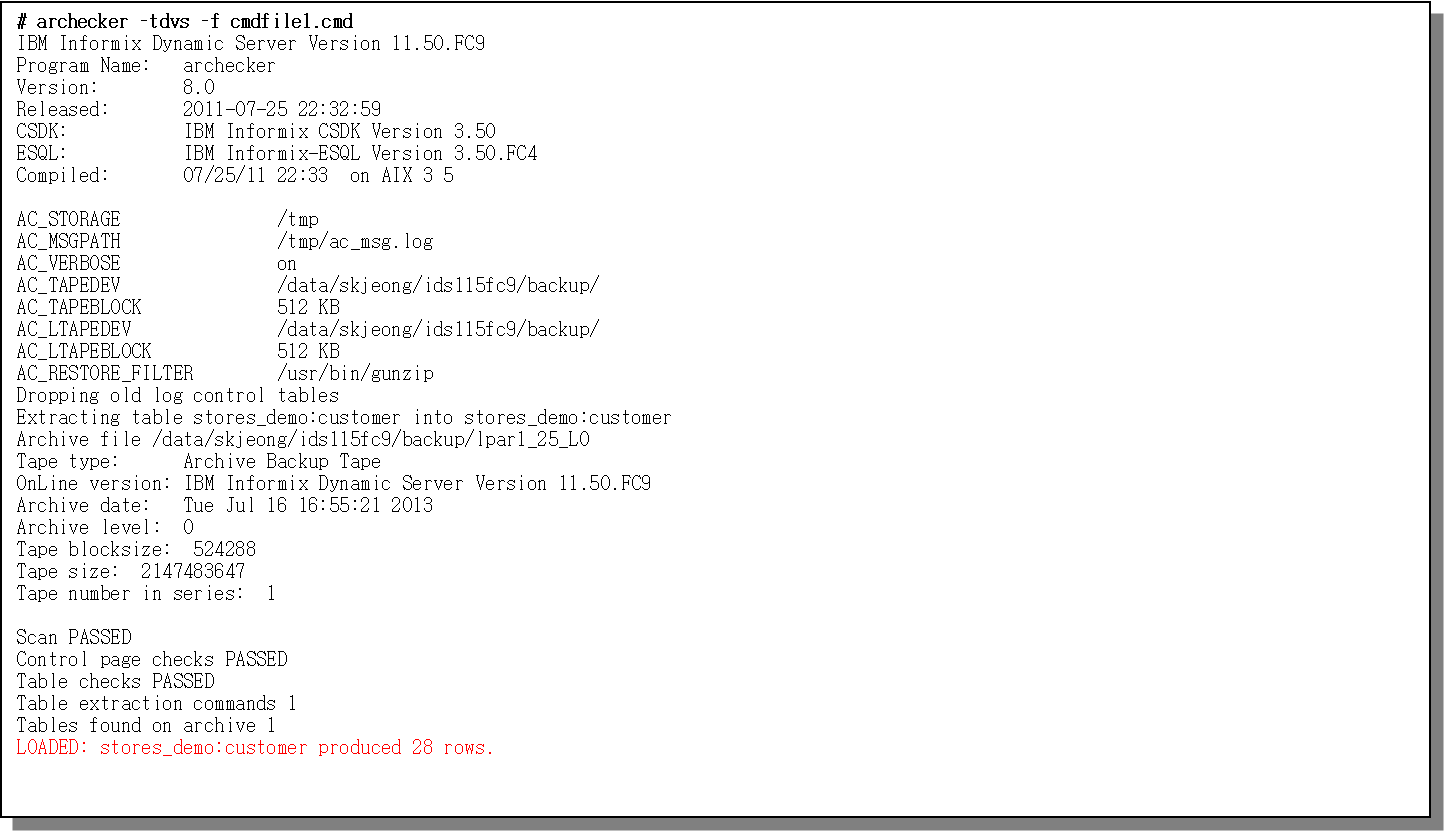
스키마 커맨드 파일이 준비되면 archecker를 실행하여 복구를 수행할 수 있습니다.

archecker 유틸리티 실행 예시

기존 데이터에 영향없이 과거 데이터를 별도 공간에 복구하는 방법이기 때문에 매우 유용한 기능입니다.

대신 스키마 정보가 꼭 필요하기 때문에 수시로 백업이 되어야겠죠.

이 기능은 별도 라이센스가 필요하지 않으므로 인포믹스 무료 버전인 Innovator-C 에디션에서도 사용가능합니다.

728x90
728x90

안녕하세요. DBeaver와 같은 JDBC 연결 프로그램에서 인포믹스의 한글 데이터가 깨져보이는 경우가 있습니다.

이런 현상을 해결하기 위한 방법을 정리해보려고 합니다.


우선 대부분의 경우는 인포믹스 데이터베이스 로케일이 영문일 가능성이 높습니다.

아래와 같이 데이터베이스의 로케일을 확인하실 수 있습니다. 영문 로케일은 일반적으로 en_US.819 로 표시됩니다.

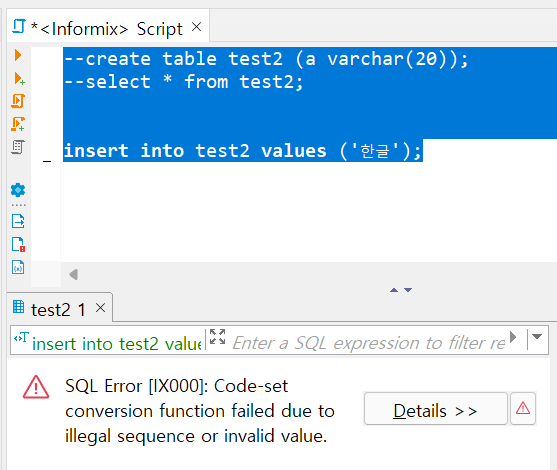
데이터베이스에 한글 데이터 INSERT 문장을 실행하면 오류메시지(Code-set conversion function failed due to an illegal sequence or invalid value.)가 발생합니다.

이번에는 터미널에서 한글 데이터를 입력해놓고 조회를 해봅니다. 조회는 오류가 발생하지 않지만 아래처럼 알아볼 수 없는 깨진 글자가 나옵니다.

근본적인 해결방법은 데이터베이스 생성시 한글 코드를 지원하는 데이터베이스에 마이그레이션 하는 것이 좋지만, 실제 사용중인 데이터베이스를 변경하기는 어려우므로, JDBC Driver에서 지원되는 기능을 사용하여 이 현상을 우회할 수 있습니다.


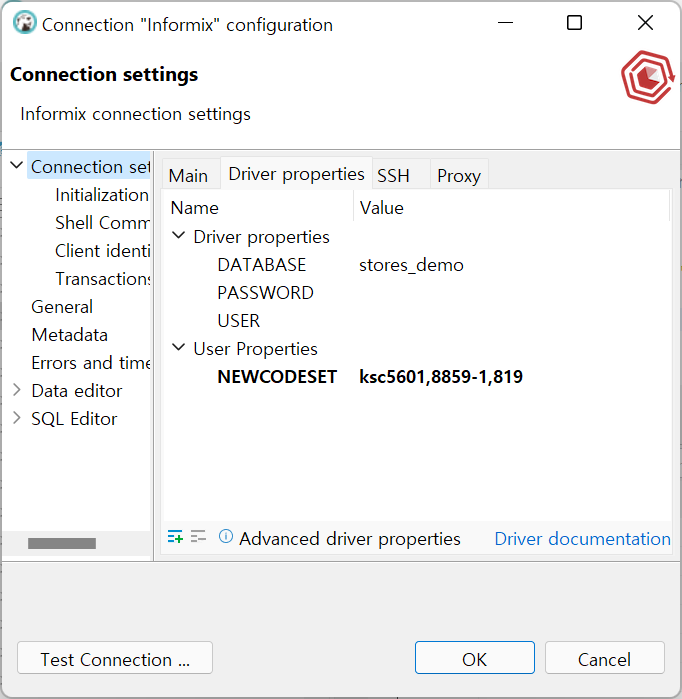
DBeaver Connection 설정에서 JDBC Driver 사용자 속성 NEWCODESET을 추가합니다.

해당 속성을 추가해서 JDK 로케일(ksc5601)과 인포믹스 JDBC 드라이버의 내부 테이블(8859-1,819)과 매핑시킬 수 있습니다.

속성을 추가한 후 새로 데이터베이스에 연결하면 한글 데이터 입력과 조회 모두 잘 실행됩니다.


NEWCODESET 속성은 인포믹스 서버 10버전 부터 소개되고 있는데, 이에 대응하는 JDBC Driver는 3버전 이상입니다.

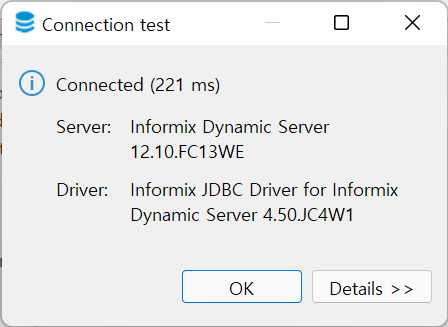
DBeaver에서 JDBC Driver 3.00.JC1 버전으로 연결 테스트를 해보니 오류가 나네요. 최소 3.5버전 이상으로 테스트 해보시길 바랍니다.

728x90
728x90

안녕하세요. Informix에는 연도별 주차를 계산하는 기능이 없어서 찾아보다가 다른 코드를 보고 따라서 만들어 보았습니다. 주차에 대한 개념이 없다보니 커뮤니티와 블로그, 위키 자료들을 참고했는데요. 일반적으로 쓰이는 형태가 ISO 8601 표준이라고 합니다.

ISO 8601에 따르면 1주차에 대한 정의는 아래와 같습니다.

  • 시작 연도의 첫 번째 목요일이 포함된 주
  • 1월 4일이 있는 주
  • 시작 연도에 일의 대부분(4일 이상)이 있는 첫 번째 주
  • 12월 29일 - 1월 4일 기간의 월요일로 시작하는 주

아래와 같이 다양한 DBMS에서 함수를 사용하여 특정일자에 대한 주차를 구할 수 있습니다만.. Informix는 자체 기능이 제공되지 않아서 아쉽군요.

DBMS 제공함수 사용예시
Oracle TO_CHAR TO_CHAR(DATE '2021-08-25' , 'IW')
Db2 TO_CHAR TO_CHAR(DATE '2021-08-25' , 'IW')
MySQL WEEK WEEK('2021-08-25', 3);
MariaDB WEEK WEEK('2021-08-25', 3);
SQL Server DATEPART DATEPART(ISOWK,'2021-08-25')
PostgreSQL DATE_PART / EXTRACT DATE_PART('WEEK', '2021-08-25'::DATE)
EXTRACT('WEEK' FROM '2021-08-25'::DATE)
Sybase DATEPART DATEPART(CWK, '8/25/2021')

Informix에는 기본 내장된 함수가 없기 때문에 계산 방식에 대해서 조사를 했습니다.

위에서 상술된 조건을 만족해야하고, Informix에서 datetime 을 일자로 변환하여 계산하는 등의 몇가지 시행착오가 있었습니다.

create function weeknum ( dt varchar(10) )
returning int;
define wknum int;
select trunc(((to_date(dt, '%Y-%m-%d') - yearstart)::interval day(3) to day::varchar(12)::integer) / 7) + 1
into wknum
from
(
select case when nextyr <= to_date(dt, '%Y-%m-%d') then nextyr
            when curryr <= to_date(dt, '%Y-%m-%d') then curryr
            else prioryr 
       end yearstart
from 
(
select  
        mdy(1,1,1753) + trunc(((jan4 - 1 units year - mdy(1,1,1900) + 53690 units day)::varchar(12)::integer) / 7) * 7  units day prioryr,
        mdy(1,1,1753) + trunc(((jan4                - mdy(1,1,1900) + 53690 units day)::varchar(12)::integer) / 7) * 7  units day curryr,
        mdy(1,1,1753) + trunc(((jan4 + 1 units year - mdy(1,1,1900) + 53690 units day)::varchar(12)::integer) / 7) * 7  units day nextyr
from (
select mdy(1,1,1900) + (extend (to_date(dt, '%Y-%m-%d'), year to year) - mdy (1,1,1900))::varchar(12)::integer units year + 3 units day jan4 from dual
)
)
);
return wknum;
end function;


아래와 같은 방식으로 Informix에서 특정 일자에 대한 주차를 구할 수 있습니다. 위 함수를 수정하면 쿼리형태로도 사용 가능할 것 같습니다.

> select weeknum ('2021-08-25') from sysmaster:sysdual;
(expression)
          34


https://en.wikipedia.org/wiki/ISO_8601

https://en.wikipedia.org/wiki/ISO_week_date

https://www.toolbox.com/tech/oracle/question/how-the-week-number-is-being-derived-121815/

https://www.sqlteam.com/forums/topic.asp?TOPIC_ID=60515 

http://www.whitemiceconsulting.com/informixintervaltips201609

https://www.sqlservercentral.com/articles/a-simple-formula-to-calculate-the-iso-week-number

https://4js.com/online_documentation/fjs-fgl-3.00.05-manual-html/c_fgl_odiagmsv_005.html


728x90
728x90

14.10.xC6 버전부터 Round robin 방식으로 분할된 테이블의 개선된 기능을 소개드립니다.

Round robin 분할 방식로 구성된 테이블은 데이터가 지정된 DBspace를 순환하며 입력됩니다.

-- Round robin 분할 테이블에 데이터 입력
> create table test (a int) fragment by round robin in dbs1,dbs2;
Table created.
> insert into test select level from sysmaster:sysdual connect by level <= 5000;
5000 row(s) inserted.
-- 분할된 파티션 별 데이터 건수 확인
$ oncheck -pt demo:test | egrep 'partition|rows'
                  Table fragment partition dbs1 in DBspace dbs1
    Number of rows                 2500
                  Table fragment partition dbs1 in DBspace dbs2  
    Number of rows                 2500

위와 같은 상태에서 새로운 DBspace를 round robin 스키마에 추가하면, 기존 데이터는 이동하지 않고 새로 입력되는 데이터는 기존처럼 DBspace를 순환하며 입력됩니다.

-- Round robin 분할 테이블에 새로운 DBspace 추가
> alter fragment on table test add  dbs3;
Alter fragment completed.
> insert into test select level from sysmaster:sysdual connect by level <= 3;
3 row(s) inserted.
-- 분할된 파티션 별 데이터 건수 확인
$ oncheck -pt demo:test | egrep 'partition|rows'
                  Table fragment partition dbs1 in DBspace dbs1
    Number of rows                 2501
                  Table fragment partition dbs2 in DBspace dbs2
    Number of rows                 2501
                  Table fragment partition dbs3 in DBspace dbs3
    Number of rows                 1

14.10.xC6 버전부터는 Round robin 방식으로 구성된 테이블에 데이터가 입력될 경우, 가장 데이터 건수가 적은 파티션에 우선적으로 입력됩니다.

-- Round robin 분할 테이블에 데이터 입력
> create table test (a int) fragment by round robin in datadbs1,datadbs2;
Table created.
> insert into test select level from sysmaster:sysdual connect by level <= 5000;
5000 row(s) inserted.
-- Round robin 분할 테이블에 새로운 DBspace 추가
> alter fragment on table test add datadbs3;
Alter fragment completed.
> insert into test select level from sysmaster:sysdual connect by level <= 3;
3 row(s) inserted.
-- 분할된 파티션 별 데이터 건수 확인
$ oncheck -pt demo:test | egrep 'partition|rows'
                  Table fragment partition datadbs1 in DBspace datadbs1
    Number of rows                 2500
                  Table fragment partition datadbs2 in DBspace datadbs2
    Number of rows                 2500
                  Table fragment partition datadbs3 in DBspace datadbs3
    Number of rows                 3


파티션 별로 데이터량을 균등하게 유지하는 측면에서 좋은 기능인 것 같습니다. UPDATE 문장으로는 데이터가 이동하지 않더군요. 참고하시길 바랍니다.


728x90

+ Recent posts